|
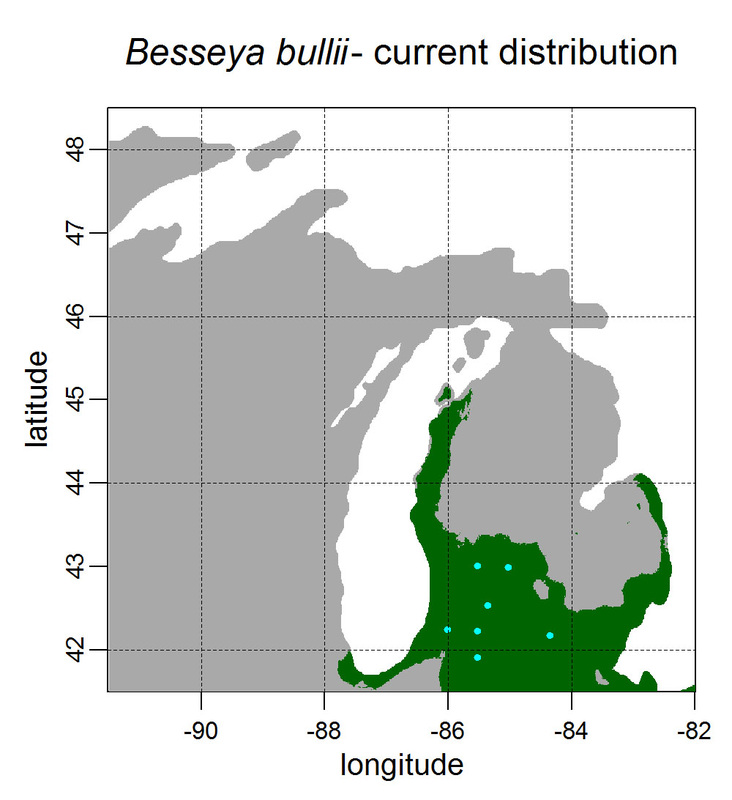
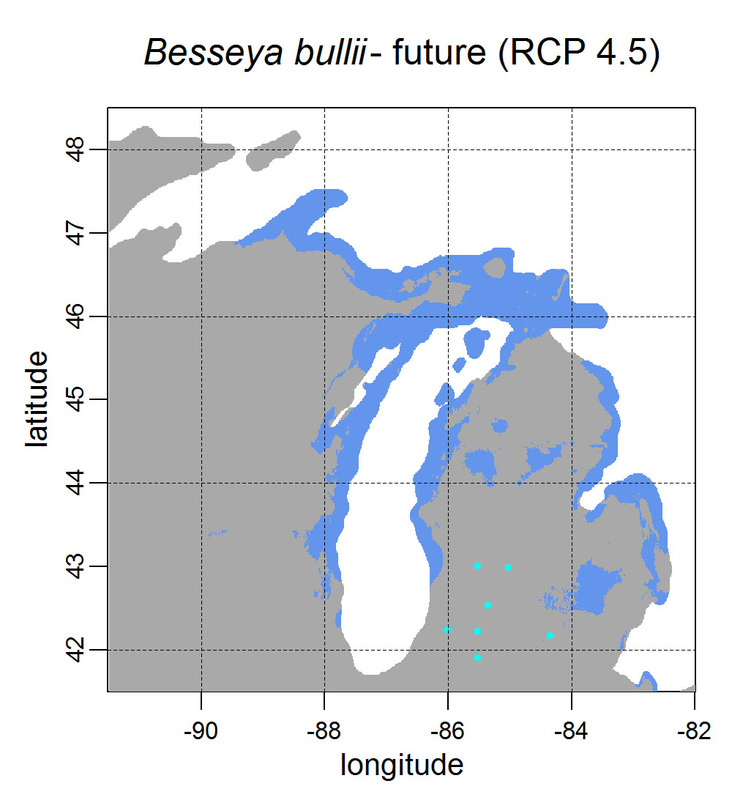
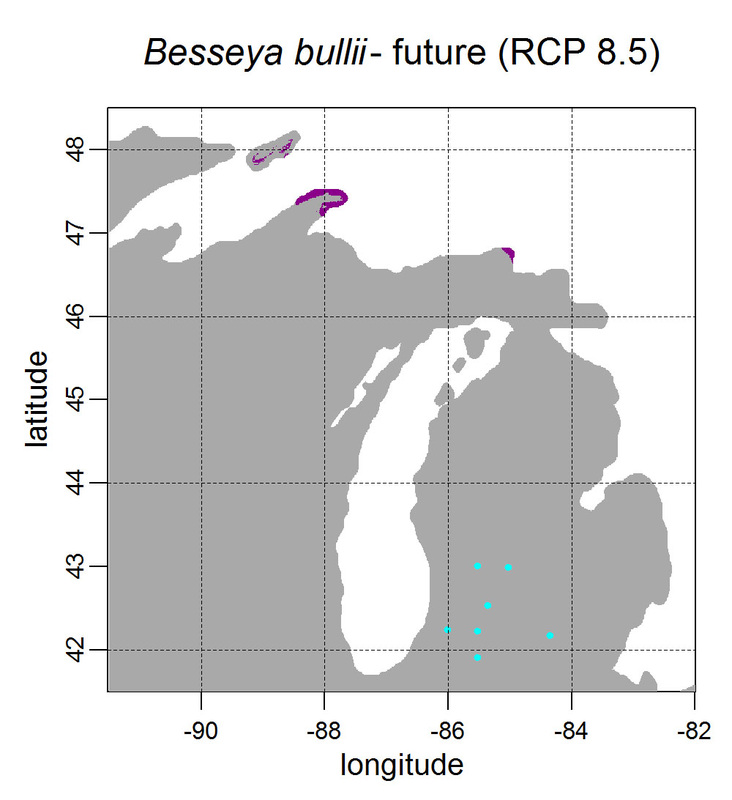
Yesterday I started teaching R in my very small class - GEO401: Geography of Plants of North America - in order to introduce (1) programming and (2) species distribution modeling. I mentioned on twitter that I'd done so and it had gone well, and I got a lot of positive responses, so I thought I'd actually post what I'm doing here, in case it's useful to y'all. The lab is basically modeling the climate envelopes of rare plants of Michigan using present day climate (1980-2000) and two future climate scenarios (CESM-BGC RCP 4.5 and 8.5 for 2080-2099). As a side note, the class has a mix of juniors to grad students, with a wide range of backgrounds in computering. We meet for 1:20 twice per week. We've already discussed lots about controls on species distributions (climate and beyond), SDMs, and why coding is worth at least trying. We started off making sure everyone had R and RStudio loaded, then went through the rforcats.net tutorial, minus the 'lists' part, because I think that's just too confusing for new people. And not essential. We're dedicating three class meetings to this - one for getting set up and running through rforcats, then two to work on getting figures made (using red and blue sticky notes, a la software carpentry), including time with me stepping through the code on the projector. The goal is that the students will produce all of a series of figures of their plants' distributions in class, which will then be the figures they use for their final papers. Below are links to the lab instructions, the R code, and the climate data files for Michigan. If you have any constructive comments or suggestions on these, I'd love to hear them, and if you'd like to know more about how to download and process climate data for your state or for a different climate model from NEX feel free to contact me and I can send you info and/or code. DISCLAIMER: This is NOT how I would go about species distribution modeling for a scientific publication. If you're thinking about doing that, a good place to start is Elith & Leathwick (2009). The goal of this class project is just to create simple, understandable climate envelope maps for students who've never used R before. GEO401 SDM Lab Instructions SDM R Code Climate tifs (zipped) And here are some example figures as generated from the code:
8/4/2022 09:42:00 am
Edirne baymak servisi için hemen websitemize göz at! https://www.edirneklimaservisi.com/edirne-demirdokum-servisi/ 8/11/2022 05:03:48 am
İçerik çok güzel. Gazipaşa transfer: https://www.alanyagroup.com/haberler/gazipasa-transfer-7-24/ Leave a Reply. |
ERSAM Lab ThoughtsThis is where we occasionally post things that are not research, but more than 280 characters. If you want to know what we're working on now, this would be a good place to look. Code will be linked to here and posted on github. Archives
November 2018
Categories |

 RSS Feed