|
This weekend a new paper by me (Kyla) and Toby Ault (Cornell, Dep of Earth & Atmospheric Sciences; http://ecrl.eas.cornell.edu/) was published in the International Journal of Applied Earth Observations and Geoinformation. Toby and I started talking about these ideas waaaaaay back when we were both ASP postdocs at NCAR. After many iterations, discussions about how to best represent these concepts, some interesting other works that came out in a similar vein (namely Zhu et al. (2017) and Gonsamo et al. (2016)), and more iterations, here it finally is: https://www.sciencedirect.com/science/article/pii/S0303243418301892 (you should also be able to access here: https://doi.org/10.1016/j.jag.2018.02.017 and it should be available for free for a while but the link hasn't been working all that great: https://authors.elsevier.com/a/1WhaE14ynSEdN4 ! (paywalled after 4/29/2018 – sorry! If you don’t have access and want to read it please email me) The very short version of the paper is that while we have long understood the idea of atmospheric teleconnections, we know less about the connections between these climatic patterns and terrestrial ecosystems, and there are lots of interesting patterns to be found. The four teleconnection modes we considered (El Nino/Southern Oscillation (ENSO), the North Atlantic Oscillation (NAO), the Atlantic Meridional Mode (AMM), and the Indian Ocean Dipole Mode (IODM)) have really interesting and really widespread correlations with leaf area index (LAI3g; Zhu et al., 2013) when you use a method that allows for variation in lag times, types of correlations (min, mean, max), etc, even with a pretty restrictive set of rules about what counts as a significant correlation (we eliminated non-statistical significance, obv, but also removed patches that were equal to or smaller than what you would expect to find randomly). Our hope is that the maps in this paper will inspire ecologists and land manager-types to think a bit beyond just ENSO when they think about long-term climate patterns impacting ecosystems. To that end, we’ve posted all of the geoTIFFs behind the figures in the paper online on FigShare (https://doi.org/10.6084/m9.figshare.5948404.v1) so folks can download them and zoom in on areas they are particularly interested in. The figures (especially the rainbow one) are also a bit hard to visually interpret in the published paper, so downloading the data behind them will hopefully make them easier to think about. To that end, I thought I’d make a few zoomed in figures here to highlight some interesting parts of the paper and maybe spark some ideas. Note: I picked and chose what other landmarks/boundaries to add to the maps to make them hopefully easier to interpret. Sorry if you don't find the added layers useful! The Amazon: There are LOTS of conversations happening about what is going on in the Amazon (not our area of expertise). We took a very data-driven approach to looking for patterns, and we show a clear difference in responses between the northern and southern Amazon. Because I’m interested in savanna ecosystems, I was particularly interested in the clear signal from ENSO in the Roraima savanna area of northern Brazil, southern Venezuela (La Gran Sabana) and western Guyana. 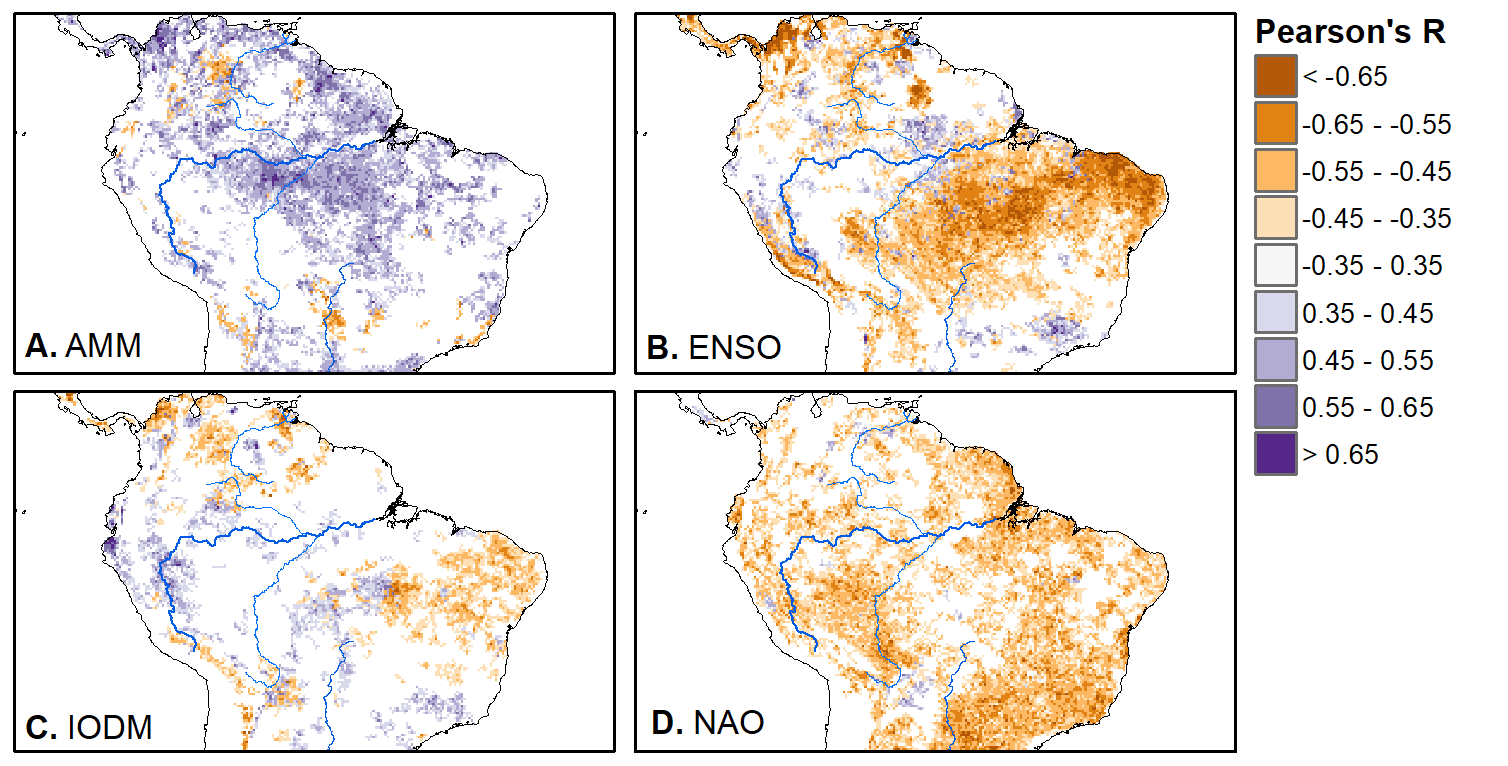 East Africa: OK, so, ENSO and the IODM are statistically correlated (see Fig S2 in paper) but it was surprising to us (though not to plenty of other people in the literature) that the signal from the IODM is so much stronger in East Africa than the signal from ENSO. These are two fairly independent climate patterns, and while there’s a decent amount of climate literature tying the IODM to precip patterns in East Africa, the bulk of the ecological literature seems pretty focused on ENSO. It’s probably worth thinking more about some of these less well known climatic phenomena. 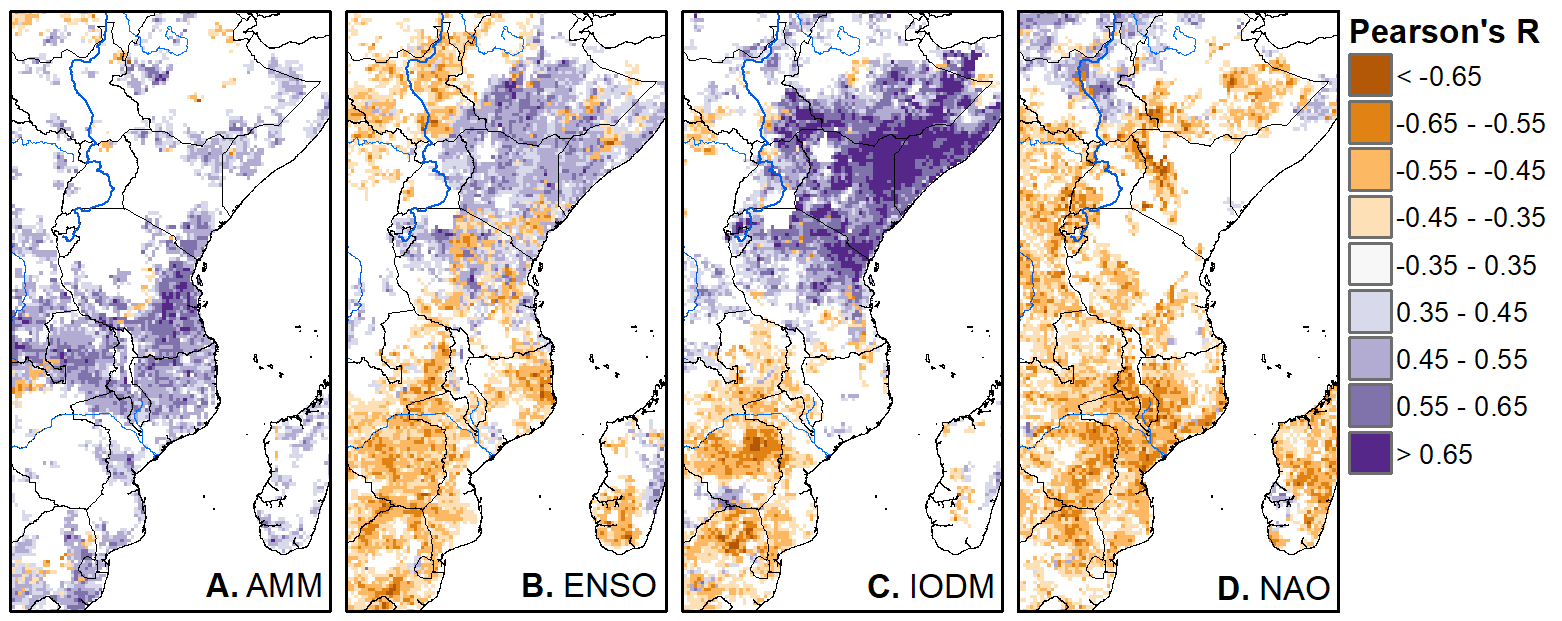 Central North America: These maps are pretty interesting in that they confirm a lot of what we already know about ENSO (strong connections in the SW US and Mexico) and therefore suggest that the approach we took works, but they also raise some interesting questions. For instance, what’s up with the central Midwest and the NAO? The AMM and eastern Colorado? 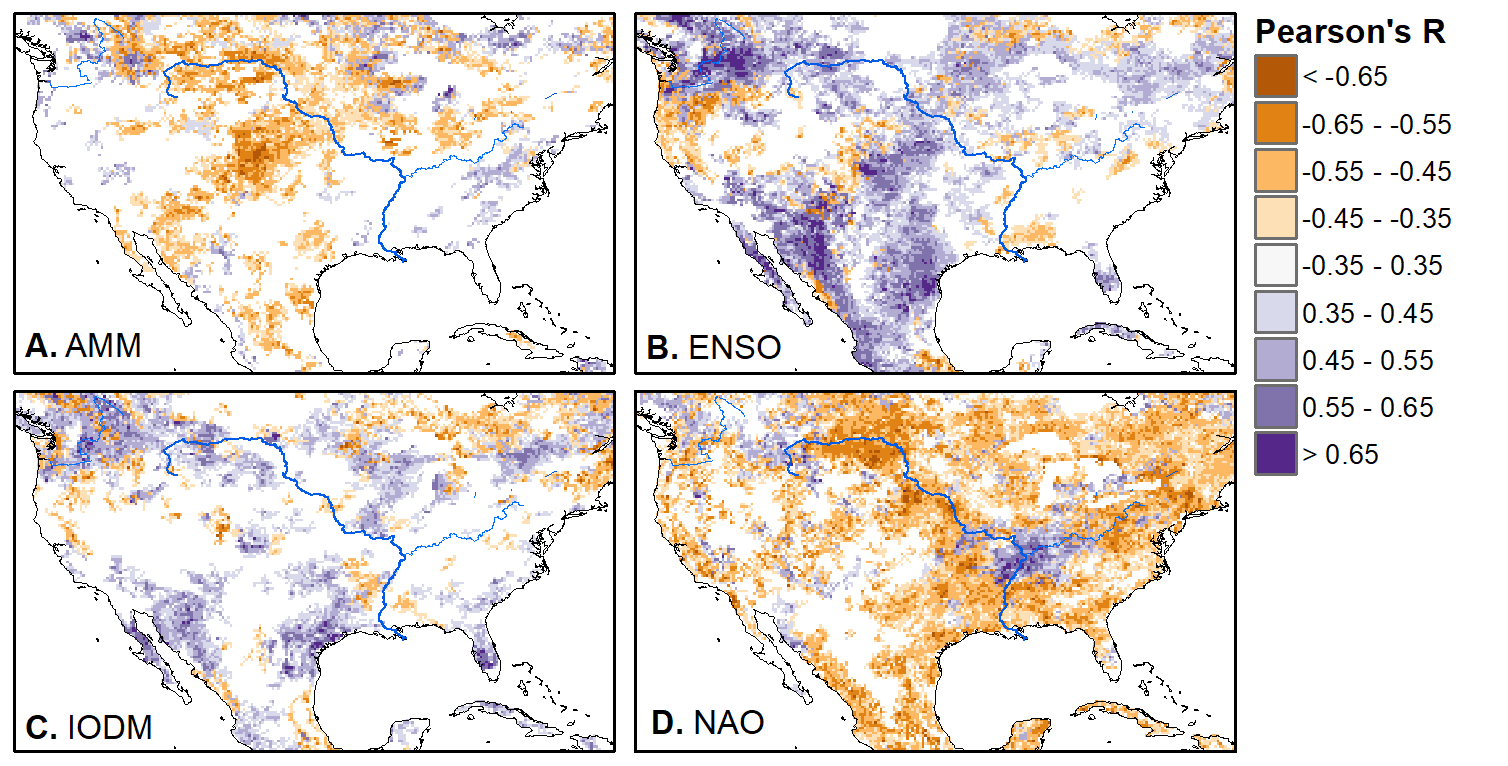 We hope that this first global-scale study of these four teleconnection patterns and their links to LAI lead to more detailed studies about particular areas and their long-term connections to climate. We also think that these patterns could potentially help inform Earth system models as 'second-order benchmarks'. It would be interesting to see, for example, if an Earth system model could capture the spatiotemporal patterns of the connections between a climate teleconnection and LAI, independent of the magnitudes of different indices.
REFERENCES
Leave a Reply. |
ERSAM Lab ThoughtsThis is where we occasionally post things that are not research, but more than 280 characters. If you want to know what we're working on now, this would be a good place to look. Code will be linked to here and posted on github. Archives
November 2018
Categories |

 RSS Feed